

92% of Subcontractors Floated Payroll Last Year, New Siteline Report Finds
New research quantifies the cash-flow pressures facing commercial trade contractors — and the billing practices that can help them take greater control of getting paid.
Siteline, the first billing and collections software built for commercial trade contractors, released The State of Subcontractor Billing in 2026, an industry report based on a survey of 492 construction finance and operations professionals conducted in May 2026. The findings show subcontractors are still financing the jobs they build — floating payroll, waiting the longest on retainage, and running much of the billing and collections process manually through spreadsheets and email.
The survey found that 92 percent of subcontractors floated payroll from their own pockets in the past year while waiting for payment, and 28 percent do it most months. For a trade that’s first on the job and last to be paid, the company itself becomes the lender — without any of the protections a real bank would require. And as the business grows, so does the amount of cash it has tied up in the work.
The squeeze is especially tight around retainage, where 43 percent of subcontractors wait more than 90 days to collect final payment and retainage, compared with just 15 percent of general contractors — and nearly one in five waits six months or more. Because the amount withheld is often the entire margin on a job, a sub can finish the work and still wait half a year to see its profit while fronting the costs of the next one.
“Retainage puts subcontractors in a difficult position. It keeps us from money we’ve already earned while we still have employees, suppliers, and vendors to pay,” said Martin Press, founder and president of Press Mechanical Contractors and Secretary/Treasurer of the American Subcontractor Association (ASA). “ASA is working to expand options such as retainage bonds that give subcontractors access to those funds sooner, while still providing appropriate protection for the project. At the same time, subcontractors need to manage the parts of the payment process they can control — billing accurately and on time, staying ahead of requisitions and change orders, and knowing exactly where their money stands.”
The report shows there’s plenty of room to improve on that front. Subcontractors named pay applications submitted with errors or omissions as the single biggest internal driver of their own
late payments. Sixty-seven percent spend 11 or more hours per month preparing, submitting, and tracking pay apps — the equivalent of a part-time job. And 56 percent missed a critical mechanic’s lien deadline in the past two years, putting one of their strongest payment protections at risk.
“Subcontractors have become the construction industry’s bank, and it’s a role no one asked for,” said Claire Wilson, co-founder and CEO of Siteline. “We can’t control how the industry pays, but our report shows that the better handle subcontractors have on their billing and A/R, the less time and money they lose to delays they can prevent. That’s exactly why Siteline exists: to give subs visibility into their cash flow so they can properly plan, get paid faster, and shorten the time they’re left financing the work.”
There’s appetite to fix it, too: 73 percent of subcontractors are optimistic about their financial outlook, and a majority are ready to invest in the tools to get there. The State of Subcontractor Billing in 2026 breaks down where the delays start, what they cost, and what subcontractors can do to close the gap between the work they perform and the cash they collect. Click here to download The State of Subcontractor Billing in 2026 (https://www.siteline.com/digital-download/the-state-of-subcontractor-billing-in-2026).
ABC’s Construction Backlog Indicator Plummets in July
Associated Builders and Contractors reported that its Construction Backlog Indicator fell to 8.0 months in July, according to an ABC member survey conducted July 20 to Aug. 4. The reading is down 0.8 months from both a month and year ago.
View ABC’s Construction Backlog Indicator and Construction Confidence Index for July. View the full Construction Backlog Indicator and Construction Confidence Index data series.
Every industry, region and company size experienced a decline in backlog in July. The South remains the only region with a larger backlog than one year ago.
ABC’s Construction Confidence Index readings for sales and staffing levels also fell in July, while the reading for profit margins increased. The readings for all three components remain above the threshold of 50, indicating expectations for growth over the next six months.
“Backlog fell sharply in July and is down to the lowest level since January,” said ABC Chief Economist Anirban Basu. “The data center boom masks the depth of this weakness, as there is a lack of momentum in any other segment. The 88% of ABC contractors that are not under contract to work on a data center had an average 7.5 months of backlog. That compares poorly to the 12% that are under contract to work on data centers, which have 11.4 months of backlog. This dynamic has been particularly difficult for small and mid-size contractors. Backlog in the $30-$50 million annual revenue category, for instance, fell to the lowest level since March 2020.”

Note: The reference months for the Construction Backlog Indicator and Construction Confidence Index data series were revised on May 12, 2020, to better reflect the survey period. CBI quantifies the previous month’s work under contract based on the latest financials available, while CCI measures contractors’ outlook for the next six months. View the methodology for both indicators.
ABC: Construction Materials Prices Flat in July, Up 7.4% From a Year Ago
Overall construction and nonresidential input prices both increased 0.1% in July compared to the previous month, according to an Associated Builders and Contractors analysis of U.S. Bureau of Labor Statistics’ Producer Price Index data released today.
Overall construction input prices are 7.4% higher than one year ago, while nonresidential construction input prices are 7.2% higher. Prices decreased in 2 of the 3 energy subcategories last month. Crude petroleum prices decreased 11.9%, and unprocessed energy materials decreased 7.4%. Natural gas prices were up 10.4% in July.
“Construction input prices were virtually unchanged in July, but that relatively tame behavior can be traced to the dip in fuel prices that occurred at the start of the month,” said ABC Chief Economist Anirban Basu. “Diesel fuel prices, for instance, surged more than $0.50 per gallon from the week prices were measured for the index through the end of July. Given the subsequent rebound in oil prices and ongoing increases in certain materials prices, such as lumber and iron and steel, materials prices will almost certainly continue to climb in the months to come.
“Materials prices remained up more than 7% on a year-over-year basis in July,” said Basu. “Despite this significant annual increase and the prospect of ongoing inflation, contractors on net expect their profit margins to expand over the next six months, according to ABC’s Construction Confidence Index.”


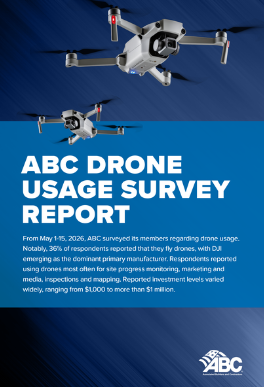
ABC Report: 36% of Contractor Members Utilize Drones on Jobsites
Other report findings include:
“In the ever-evolving construction technology landscape, drones are transforming how contractors monitor site progress, enhance branding efforts and conduct inspections with unprecedented efficiency,” said Matt Abeles, ABC vice president of construction technology and innovation.https://fasacares.org/wp-content/uploads/2026/08/Drone-survey-report.png “This ABC report details how ABC contractor members are embracing this innovation, yet regulatory hurdles and training challenges still limit broader adoption,” said Abeles. “ABC urges contractors to continue exploring the full potential of drone technology on their jobsites and calls on lawmakers to streamline compliance so employers can leverage these tools to build safer, healthier and more efficient jobsites.” ABC creates the conditions for construction companies to innovate, differentiate, attract and educate top talent to win and deliver work safely, ethically and profitably for the betterment of the communities in which they work. Visit abc.org/dronerport to read the full report. FMIWhere Does Your Segment Land in 2026?At a glance, the numbers look flat: U.S. construction spending is set to dip just above 1% in 2026, to $2.214 trillion. The market underneath it is anything but. FMI’s Q3 2026 North American Engineering and Construction Outlook shows which segments are pulling ahead and which are falling back. Behind that modest headline number is a market splitting sharply, and knowing where your segment sits matters more than the top-line number. Key Trends
See where your segment lands. The full Q3 2026 Outlook has segment-by-segment forecasts, NRCI sentiment data and metropolitan growth projections through 2030. |
 Associated Builders and Contractors released the findings of its
|
|
AGC
Construction Employment Increases In 36 States And D.C. From July 2025 To July 2026; 28 States Add Jobs From June To July As Association Warns More Jobs Are At Risk
Texas and Louisiana Have the Largest Number and Percent of 12-Month Increases, While California and Alaska Lag; Illinois and Mississippi Top Monthly Gainers, While Texas and West Virginia Have the Largest Monthly Job Losses
Construction employment increased in 36 states and the District of Columbia from July 2025 to July 2026, while 28 states and D.C. added jobs between June and July, according to an analysis of new federal data released by the Associated General Contractors of America. Association officials cautioned, however, that several policy developments, including uncertainty surrounding tariffs, highway funding and data center development, threaten to undermine near-term employment increases.
“Construction employment gains were widespread in July on both a monthly and year-over-year basis,” said Ken Simonson, the association’s chief economist. “Nevertheless, there are several risks to continuing increases in employment, including a potential lapse in federal highway funding, growing opposition to data centers, and ongoing shifts in tariff policy.”
Between July 2025 and July 2026, 36 states and the District of Columbia added construction jobs, 13 states shed jobs, and employment was unchanged in Vermont. Texas added the most construction jobs (17,500 jobs, 1.9 percent), followed by Louisiana (15,500 jobs, 11.4 percent), North Carolina (15,400 jobs, 5.5 percent), Ohio (13,700 jobs, 5.3 percent) and Illinois (12,700 jobs, 5.3 percent). Louisiana posted the largest percentage gain over 12 months, followed by Wyoming (6.2 percent, 1,400 jobs), Oklahoma (5.5 percent, 4,900 jobs), North Carolina and Nebraska (5.5 percent, 3,500 jobs).
California lost the most construction jobs from July 2025 to July 2026 (-6,700 jobs, -0.7 percent), followed by Virginia (-5,800 jobs, -2.5 percent), New York (-5,700 jobs, -1.5 percent), New Jersey (-4,900 jobs, -2.9 percent) and Georgia (-3,200 jobs, -1.4 percent). The largest percentage loss was in Alaska (-3.7 percent, -700 jobs), followed by New Jersey, Virginia, New Hampshire (-2.5 percent, -800 jobs) and Maine (-2.5 percent, -900 jobs).
For the month, industry employment increased in 28 states, declined in 18 states and D.C. and was unchanged in Oregon, North Dakota, Delaware and Nebraska. Illinois added the most construction jobs (3,200 jobs, 1.3 percent), followed by Ohio (3,000 jobs, 1.1 percent), California (2,900 jobs, 0.3 percent), Florida (2,900 jobs, 0.4 percent) and Louisiana (2,300 jobs, 1.5 percent). The largest percentage gain occurred in Mississippi (1.9 percent, 1,000 jobs), followed by Rhode Island (1.8 percent, 400 jobs), Louisiana (1.5 percent, 2,300 jobs), and Kansas and Illinois (1.3 percent, 1,000 and 3,200 jobs, respectively).
Texas lost the most construction jobs from June to July (-3,400 jobs, -0.4 percent), followed by Alabama (-2,200 jobs, -1.9 percent), Washington (-2,100 jobs, -1.0 percent), Arizona (-1,300 jobs, -0.6 percent), Virginia (-1,300 jobs, -0.6 percent) and New Jersey (-1,300 jobs, -0.8 percent). The largest percentage loss was in West Virginia (-2.8 percent, -1,000 jobs), followed by Alabama, D.C. (-1.4 percent, -200 jobs), Vermont (-1.2 percent, -200 jobs) and Alaska (-1.1 percent, -200 jobs).
Association officials said that several policy developments could derail some of the industry’s strongest sources of demand. Growing state and local resistance to data center development, the lack of progress in Congress on a long-term highway and transit bill, and frequent changes in tariffs on construction materials all pose significant threats to future construction activity.
“Construction firms continue to add workers where demand remains strongest,” said Jeffrey D. Shoaf, the association’s chief executive officer. “Policymakers can help sustain that momentum by passing a new highway and transit funding bill before the current law expires on September 30, supporting responsible growth in data centers, and avoiding policies that increase the cost of key construction materials and create unnecessary uncertainty for construction employers.”
View July 2026 state employment data and 1-month, 12-month rankings.
AIA
Architecture firm billings remain weak in July
The AIA/Deltek Architecture Billings Index® (ABI) score for the month was 46.6, indicating somewhat further softening from June. The persistent downturn in business conditions now extends to nearly three and a half years, as many firms continue to struggle to grow their billings. Clients are still bringing business to firms, as inquiries into new projects rose again in July, although at a slower pace than in June. However, the value of newly signed design contracts declined further after nearly approaching growth last month.
Business conditions also remained weak at firms in all regions of the country in July. Firms located in the Northeast reported the softest conditions for the second consecutive month, while the pace of the ongoing decline slowed slightly at firms in the other three regions. Billings declined at firms of all specializations as well. While firms with multifamily residential and institutional specializations both saw slight growth earlier this year, conditions have softened since then. Firms with a commercial/industrial specialization, on the other hand, have not reported an increase in billings since four years ago this month.
Broader economy remains uneven as inflation pressures persist
Conditions remained relatively mixed in the broader economy in July. Nonfarm payroll employment decreased for the second time this year, shedding 23,000 jobs in July. Construction employment remained generally flat, while architecture services employment declined by 100 positions in June (the most current data available). June marked the fourth consecutive month of declines in employment in the industry, which has lost a total of 900 jobs so far since January.
Inflation remains high, as the Consumer Price Index (CPI) increased by 0.1% from June to July, after declining by 0.4% from May to June. Shelter and food (particularly away from home) were the primary contributors to the increase this month, although energy prices declined by 1.5%. In better news, consumers were somewhat more optimistic, with the University of Michigan’s Index of Consumer Sentiment rising by 11.5% in July. However, the overall index remains down by 10.5% from one year ago, as purchasing power/inflation remains a key issue for consumers.
Architecture firms weigh mergers and acquisitions as a strategy for growth and long-term stability
This month’s special questions asked firms about merger and acquisition activity in the architecture industry. Overall, 30% of responding firm leaders reported that they have either gone through with a merger or acquisition or actively considered one over the last year. Large firms with annual billings of $5 million or more (43%), firms located in the South (39%), and firms with a commercial/industrial specialization (35%) were the most likely to report having gone through with, or actively considered, a merger or acquisition. Of the different types of merger and acquisition activities, 10% of firms indicated that they actively considered being acquired by another firm, 8% that they actively considered acquiring another firm, 8% that they actively considered merging with another firm, and 4% that they went through a merger with or acquired another firm. In addition, 29% of firms indicated that they completed or considered an internal ownership transition over the last year. However, slightly more than half of firms overall (54%) reported that they have not engaged in any merger, acquisition, or ownership transition activity over the past year.
At the firms that have participated in, or considered, a merger or acquisition over the past year, 54% rated these two factors as very important in their decision: allowing the firm to compete more effectively, and that it was the best way to ensure the survival of the firm. An additional 53% rated the ability to add new markets/serve a broader area/develop an international presence, and allows for greater diversity of projects to hedge against economic cycles/construction cycles as very important factors, while 52% selected the ability to be more competitive for large projects, and 50% selected allowed owners to sell firm/realize benefits from investment as very important factors.
Overall, more than half of responding firms (59%) think that it is unlikely that their firm will be acquired by or merge with another firm over the next 3–5 years. However, nearly one quarter (23%) think that it is likely, while the remaining 18% think that it is neither likely nor unlikely. And just 14% of responding firms think that it is likely that their firm will acquire another firm over the next 3–5 years, while 69% think that it is unlikely, and 18% think that it is neither likely nor unlikely. However, large firms and firms with an institutional specialization were much more likely to project an acquisition by their firm, with 24% and 22%, respectively, rating it as likely.
As far as overall merger and acquisition trends in the industry, 65% of responding firm leaders believe that merger and acquisition activity among U.S. architecture firms is likely to increase over the coming 3–5 years, with just 2% expecting that it will decrease, and 15% anticipating that it will remain at current levels (the remaining 18% indicated that they don’t know how this activity will trend). Finally, nearly half of firms (41%) indicated that they believe that architecture firm acquisitions of/mergers with other architecture firms will be the one most common type of merger and acquisition activity that may occur over the coming 3–5 years. However, 15% think that private equity acquisitions of architecture firms will be the most common type, while 12% expect it to be architecture firm acquisitions of/mergers with other nonarchitecture firms (e.g., interior design, planning, engineering, construction), and 10% expect it to be nonarchitecture firm acquisitions of/mergers with architecture firms (the remaining 20% said that they don’t know which type of activity will be most common).